Keeping Your Data Access Honest with SQL Server Profiler
I’ve been living in the magic forest of ORMs for a number of years and for an application developer it is truly a wonderful place. Since LINQ to SQL and later Entity Framework were introduced I can honestly say I’ve been a happier developer. Writing data access code for a new project is usually fun the first day but it gets tedious and tiring quickly. By the end of each day you’ve written hundreds of lines of code that could and should be written for you or abstracted away by magic data access fairies.
Despite understandable skepticism from some DBAs, modern ORMs do a great job and do lower the costs of developing and maintaining software. As a bonus they make software developers happy and that’s often the secret sauce in the success of a large software project.
I’ve been working on an application for a number of years that started with LINQ to SQL and later moved to Entity Framework. Very early in the development lifecycle we spent a lot of time validating our data access. We learned how to adjust our LINQ statements to emit efficient SQL, we tuned our table indexes as necessary, and threw an occasional stored procedure into the mix when we needed a little heavy lifting done.
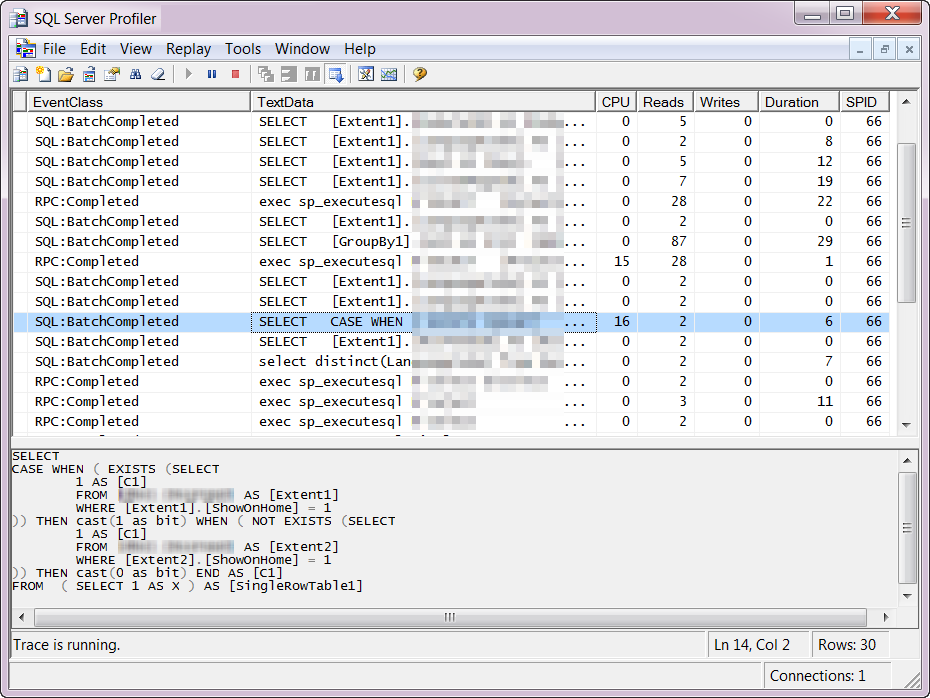
It seems we may have started to put too much trust in ORM’ing in the last year or two because while evaluating a web page that was taking a few too many seconds to load I found something that came as a bit of a surprise: a page that had become very intimate with our database – in our case almost 500 SQL statements worth of intimacy with over a million table reads.
What I relearned is that while ORMs like Entity Framework can generally be trusted they can make it easy to misuse. An important step in any database-centric software development process is to periodically evaluate your database access and validate it is behaving as expected. While many third-party tools exist to make this easy, chances are you already have a free[and powerful] one at your disposal: SQL Server Profiler. Profiling is fairly simple; just a matter of configuring a trace and you’re off and running.
Get Started
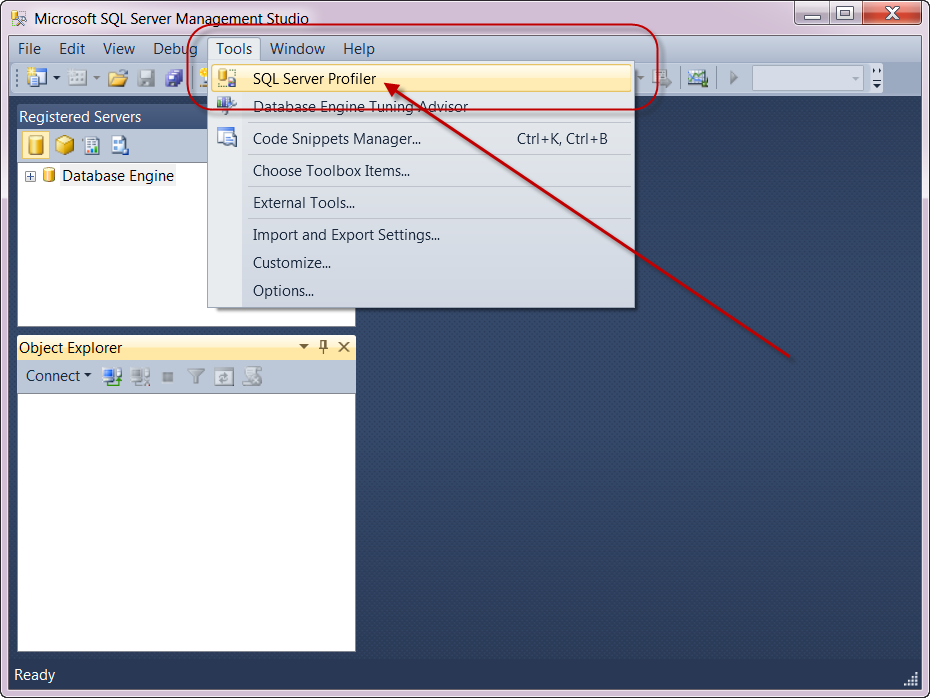
SQL Server Profiler has been included with SQL Server Management Studio since at least version 2000 and hasn’t changed to much over the years as far as I can tell. To access it from Management Studio simply select Tools > SQL Server Profiler:
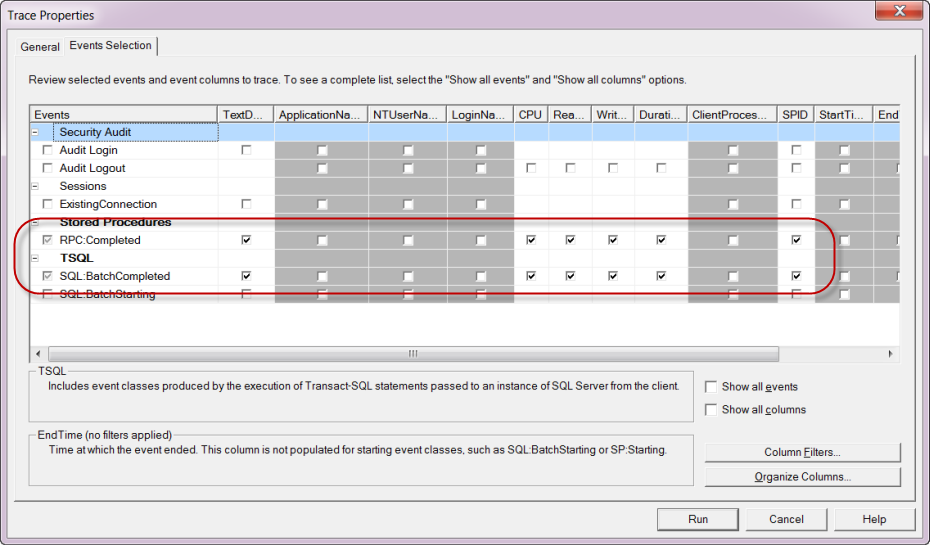
Events Selection
When you launch SQL Server Profiler you’ll first need to select your server. I’m going to assume you’ll be running application locally from Visual Studio; your SQL Server can be local or remote. Profiling tools will need to be installed and running on the database but in my experience this is the default.
Now the fun part – a profile session is called a trace and has several properties we’ll need to configure. By default, Profiler sends a lot of information back so we’ll want to configure it to filter most of the noise out.
You’ll notice on the Trace Properties > Events Selection tab six events that we can trace, we’re not too concerned with audits or connections so deselect everything but RPC:Completed and SQL:BatchCompleted.
They are a lot of columns that won’t be useful to us either, uncheck everything but TextData, CPU, Read, Write, Duration, and SPID (required).
Column Filters
To be sure we’re only seeing the databases we need and the SQL statements generated by our application we’ll need to filter our columns. Start by enabling the Show all columns checkbox and then click Column Filters…
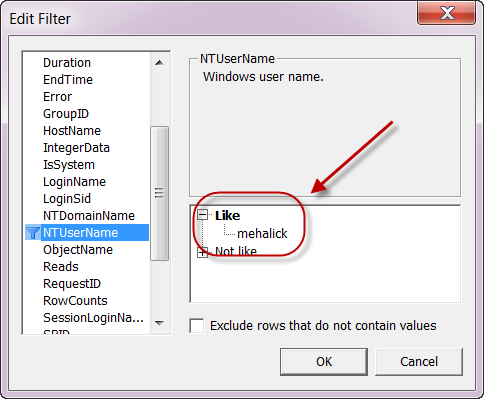
Unless configured otherwise Visual Studio will connect to your database(s) within the context of your domain account; to see only the SQL that you and your application generate select NTUserName and enter your Windows domain username excluding the domain:
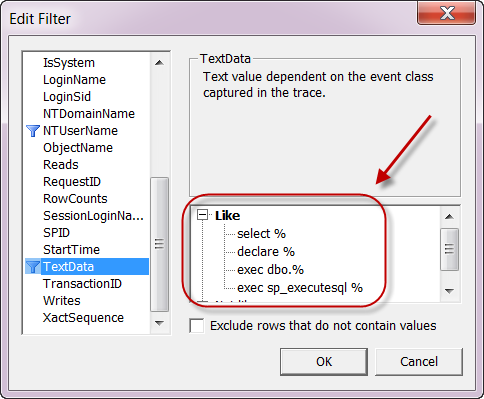
In addition to the SQL statement executions and stored procedure calls Profiler shows a bit more information than we need and we can filter this out using TextData. There are ultimately four statements that are generated by LINQ to SQL and Entity Framework and they can all be added as filters:
- select %
- declare %
- exec dbo.%
- exec sp_executesql %
Finally, if you have other applications that are interacting with your target server using your account you can add a filter on DatabaseName as well. If your application uses multiple database you can add them all.
Run
Now you’re ready, click Run and switch back to Visual Studio to start your application (with or without debugging). To look at single pages use Profile’s Start, Pause, and Clear Window buttons as you move through your application. In a future post I’ll describe how to interpret the output, save to XML, and export to Excel for analysis. Have fun